In JavaScript, the most popular (and overused) debugging method is console.log() for displaying logging information in the web browser console.
For example, here’s a basic use of log() function.
console.log('Hello!');
It works, …. but it’s also so 1990s. There are other methods provided by the web browser console that can aid you to debug better.
1. console.dir()
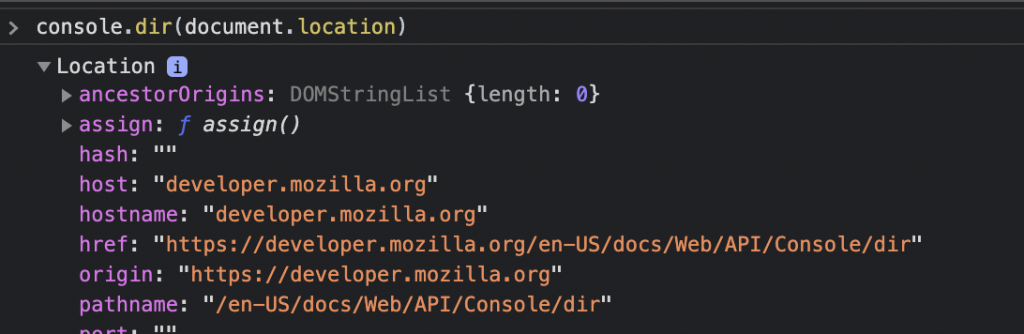
console.dir() is similar to console.log() with one important difference. log() only prints out a string representation, whereas dir() prints out a navigable tree of its object properties.
Here’s an example using console.dir() to display the current document location object.
When using console.log() on the same object, here’s the output.
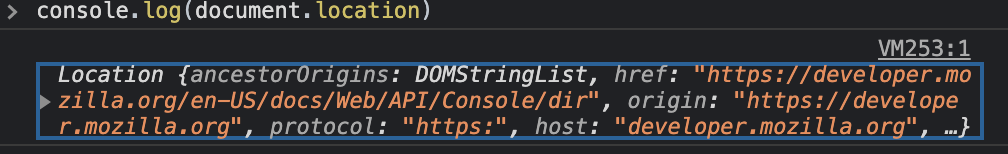
In other words, one should use console.dir() to see all the properties of the JavaScript object in a hierarchical structure. The old-fashioned log() works best with strings.
2. console.table()
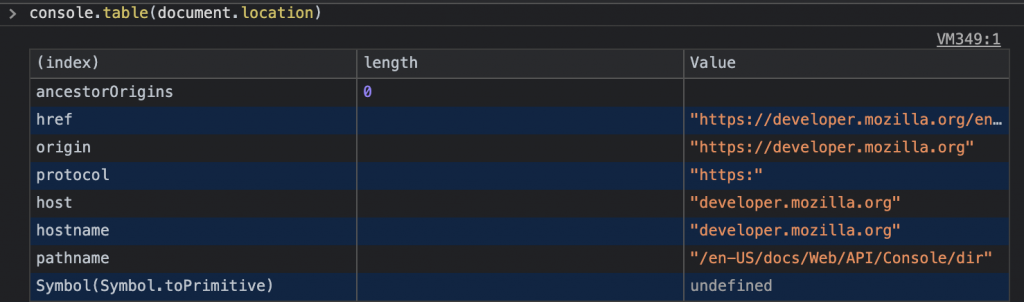
This fabulous console function takes one array or an object parameter and presents tabular data as a table.
Below is the same “document.location” displayed using console.table(). When displaying Javascript objects, console.table() puts all the properties in a tabular format to make it so much more readable. So, whenever you need to show an array or JavaScript objects with common properties, be sure to use console.table().
3. console.group()
Today’s web browsers still aren’t capable of automatically parsing and displaying a multi-level tree of javascript objects with nested properties. Thankfully, there is console.group().
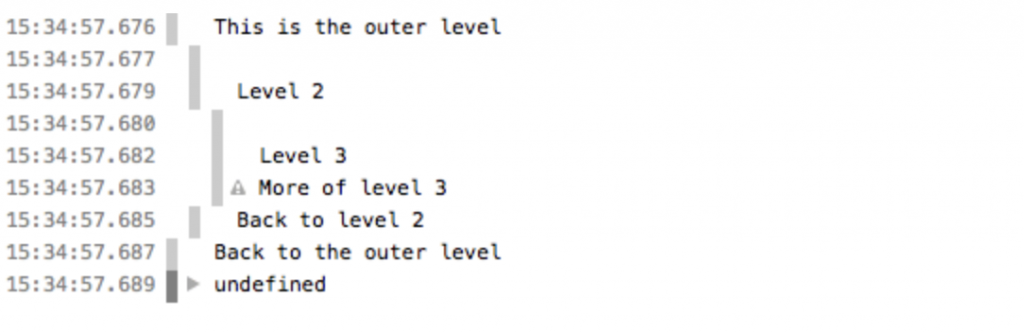
This function works in pairs with console.groupEnd() to create multi-levels, tree-like displays in the console. You can use nested groups to help organize your output by visually associating related messages.
For example:
console.log("This is the outer level");
console.group();
console.log("Level 2");
console.group();
console.log("Level 3");
console.warn("More of level 3");
console.groupEnd();
console.log("Back to level 2");
console.groupEnd();
console.log("Back to the outer level");
Output
4. console.trace()
Finally, you can’t look like a pro without knowing the console trace function, where it outputs a programming stack trace to the browser console.
Stack trace is handy when you have a function that will be executed, which will execute another function, which will another, and so on. By executing the console.trace() method in the inner function, it will display this trace in the browser console.
For instance,
function foo() {
    function bar() {
        console.trace();
    }
     bar();
}

foo();
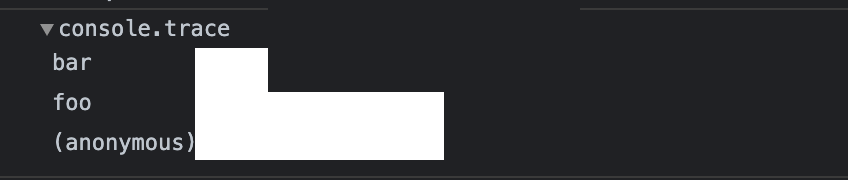
console.trace() will show you the call path taken to reach the point at which you call console.trace().
Output:
Summary
Those are console methods I found the most useful personally. While the old-fashioned console.log() works best with strings, others console functions make the console that much more readable. Hopefully, they can also make your Javascript debugging experience a bit more pleasant.
What is your take on this? Feel free to share.