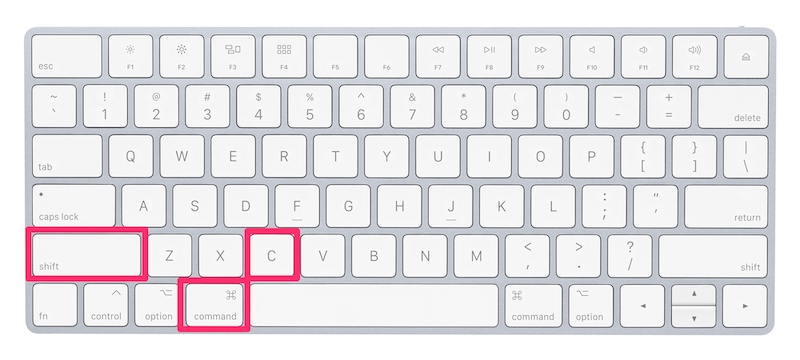
In today’s modern browsers such as Google Chrome, Firefox, Safari, and Microsoft Edge, there is a lesser-known trick that could 10 X increase your client-side debug skills for AKA javascript and CSS.
In browser, to toggle Inspecting Element for a web page, here is usually how it is done:
- Locate page element for inspection on the page,
- Right click the element,
- Click “Inspect” in context menu,
- Debug
It doesn’t look that bad, does it? Well, it works great, except when web developers have to do this many times a day, fatigue starts to creep in.
There’s a better way. And it takes only a single step.
It is called Keyboard Shortcut, or Hotkey.
A hot key is a key or a combination of keys on a computer keyboard that, when pressed at one time, performs a task such as starting an application. In modern software, almost all of them have some hotkey support. For example, a well-known universal hotkey for finding text on a page is Cmd + F, or Ctrl + F; Undo is Cmd + Z, or Ctrl + Z etc.
OK, tell me already!
Here’s the hotkey to trigger the Inspect Element Mode command in the Chrome browser.
| Mac | Windows | |
| Toggle Inspect Element Mode |
Cmd+Shift+C | Ctrl+Shift+C |
Press the hotkey will toggle the Inspect Element window. Find and click on the element to inspect and start debugging.
When it comes to client-side debugging in browsers, many nifty hotkeys can be used to boost your workflow. For example, to toggle device mode here’s the keyboard shortcut:
| Mac | Windows | |
| Toggle Device Mode |
Cmd+Shift+M | Ctrl+Shift+M |
You don’t have to master all the hotkeys at once, but taking some time to get familiar with a handful of them can drastically improve your debugging experience.
Besides, you looked pretty cool for being a swift debugging ninja.

